AON Fleet Risk Intelligence
Product: B2B platform for Fleet risk insights, from Brokers and insurers to large Fleets .
Role: UX Lead – strategy, research, design execution, product optimization.
Goal: Improve usability, accessibility, adapt for larger fleets and provide actionable insights.
Core Issues Identified:
❌ Complex visualizations – Fleet managers struggled to interpret data quickly.
❌ Poor scalability – Dashboard wasn’t optimized for larger fleets, limiting efficiency.
❌ Risk model shift – Transitioning to a unified model caused confusion, requiring clearer explanations.
❌ Expanded risk bands – Increasing from 3 bands (Poor, Fair, Good) to 5 bands (Low risk, Minor risk, High Risk, Severe risk).
❌ Data overload – Too much upfront information made it hard to extract key insights fast.
Discover, Define, Develop, Deliver
-

Discover and Define
✔ Conducted stakeholder interviews (fleet managers, insurers, analysts) , logging insights in Dovetail.
✔ Reviewed existing research artifacts to identify gaps in user needs and expectations.
✔ Analyzed competitor platforms to benchmark features and user experience.
-

Key Findings
➡ Time constraints: Fleet managers need quick, scannable insights over complex data. Charts must be clear, actionable, and easy to interpret.
➡ Progressive disclosure: Too much data overwhelmed users. Surfacing key insights first, with deeper data on demand, improved comprehension.
➡ Automation reduces workload: Manual reporting was inefficient. AI-generated reports and driver notificationsstreamlined communication.
➡ AI enthusiasm & trust: Users were eager for predictive analytics but needed transparency in AI-driven decisions.
-

Develop and Deliver
I ran cross functional workshops involving data science, engineering and product managers with design sprints focused on.
✅ Simplified charts: Focus on key takeaways, reducing clutter.
✅ Role-based dashboards: Tailor insights for managers vs. drivers.
✅ AI transparency: Explain risk scores to build trust.
✅ Auto-reports: Deliver timely, actionable insights.
Cross functional workshops
✔ Modular customizable dashboards based on user roles.
✔ Implemented progressive disclosure UX model – surfaced key insights first.
✔ Optimized mobile experience for on-the-go access.

-
Refined color contrast, typography, and visual hierarchy to enhance data clarity.
Optimized layouts to reduce cognitive load and improve scanability.for all users, including those with visual impairments.
Implemented accessibility best practices, including colorblind-friendly palettes and screen reader compatibility.
Simplified interactions to ensure easy navigation and interpretation of complex datasets.

-
Conducted usability testing to assess comprehension and refine interaction patterns.
Gathered feedback from brokers and fleet managers to ensure alignment with real-world use cases.
Aligned data visualization components with Aon’s design system for consistency.
Ensured scalability by designing flexible components adaptable to different fleet sizes and data sets.
Benchmarking Pre-Improvement Metrics
Leading metrics - DAU, WAU, Reports opened by fleet managers and drivers,
Time to assess risk per Driver/fleet ( minutes taken to interpret dashboard insights).
User-reported time estimates from fleet managers (via surveys and from customer success managers).
Number of steps/clicks required to complete a risk assessment.
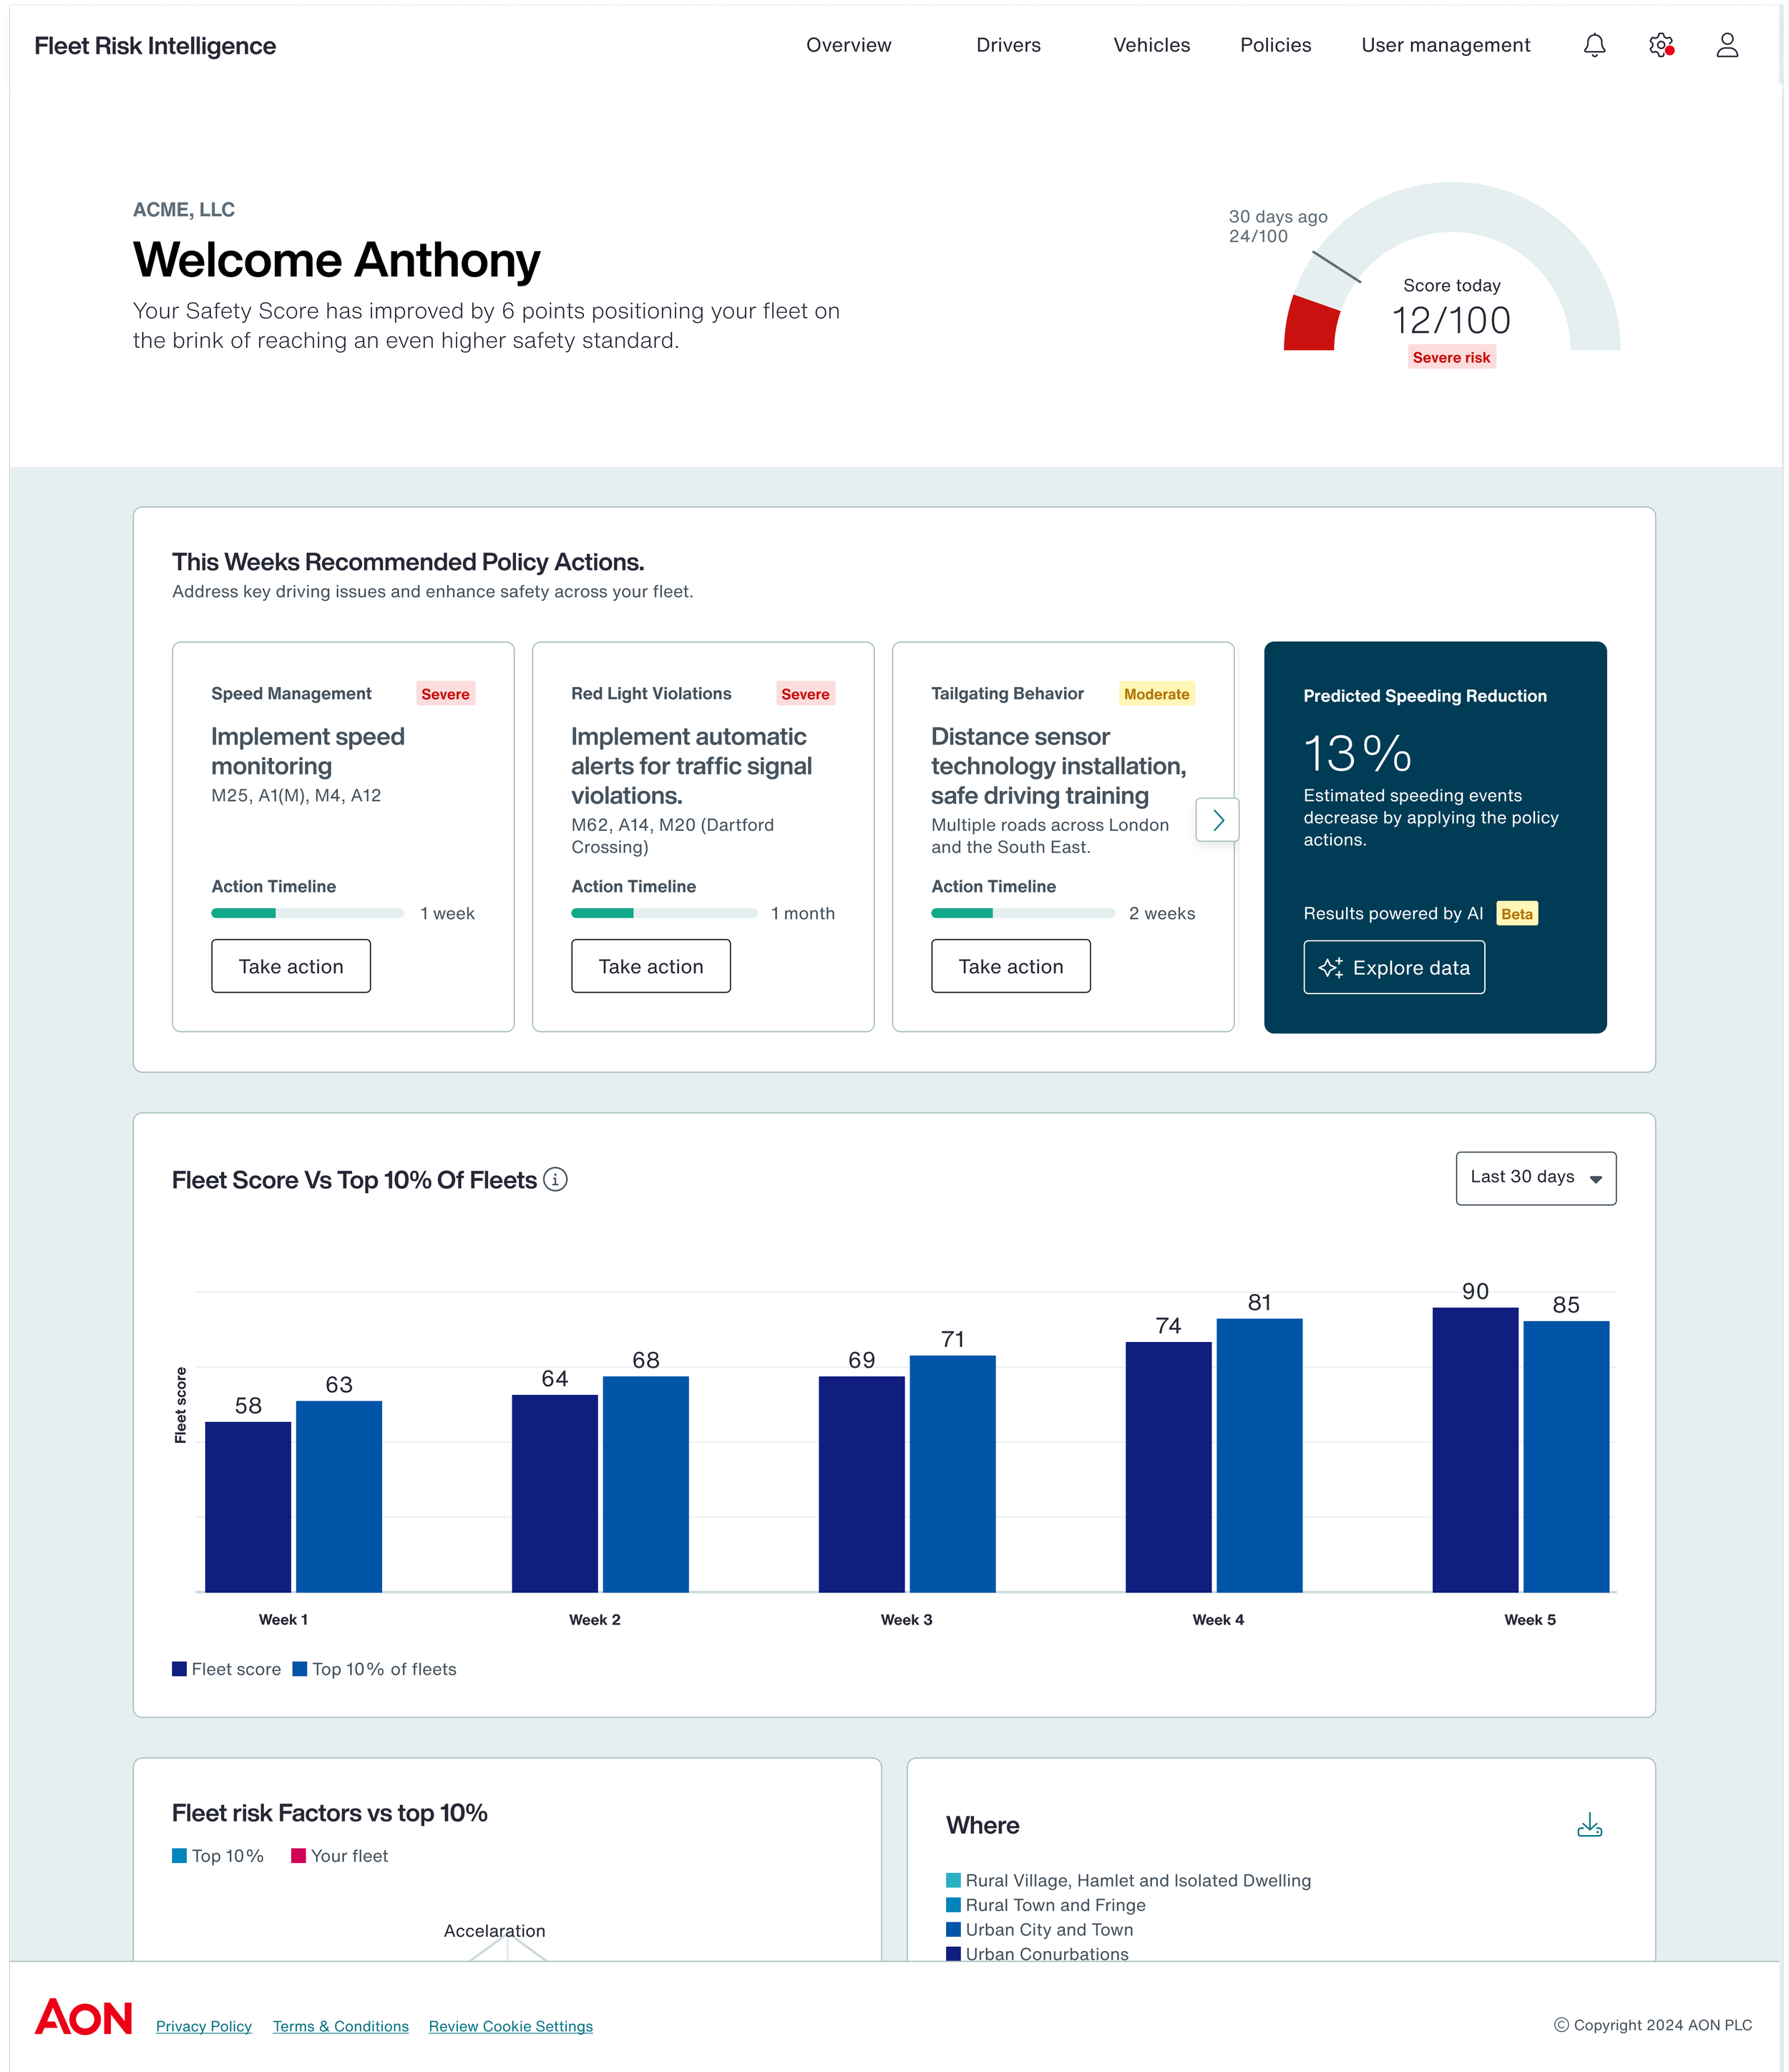
Lagging metrics - improvement Fleet/ Driver score
What this means in practice
Fleet managers used to take 5 minutes to assess risk, they now take only 3 minutes, reducing cognitive load and decision-making time.
The UX improvements (e.g., better visualizations, automated insights, progressive disclosure) contributed to this faster analysis.
Validated via usability tests, analytics (session duration, click reduction), or user feedback.
Wireframing, Prototyping, and Testing
Wireframing: Started with low-fidelity wireframes and sketches to quickly iterate on ideas and capture early feedback. This allowed me to explore design solutions without committing extensive time to high-fidelity designs.
Prototyping: Once the wireframes were validated, I created interactive prototypes to test user flows and interactions. These prototypes were designed to simulate real user scenarios, allowing for quick adjustments and optimization.
Usability Testing: Conducted task-based evaluations and A/B tests to compare old workflows with the new design. This helped identify pain points, fine-tune the design, and ensure the solution addressed user needs.
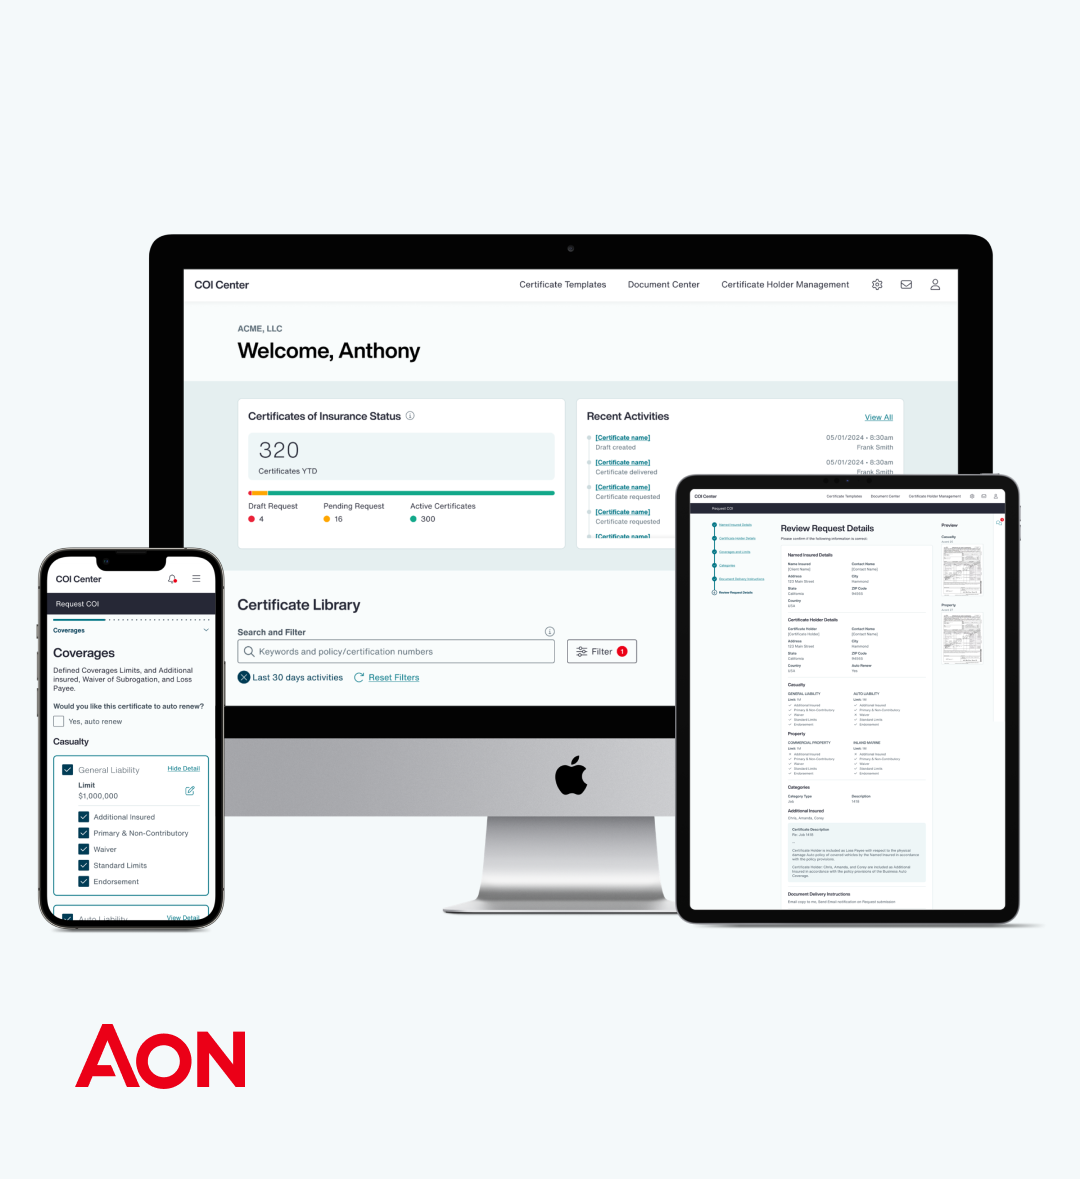
Completed Wireframes and Designs
-
![]()
User needs
Utilized Aon's global design system to ensure consistency across platforms.
Created custom components when specific platform needs arose, ensuring a balance between brand consistencyand design flexibility.
Prioritized user efficiency, reducing cognitive load and ensuring fast decision-making.
-
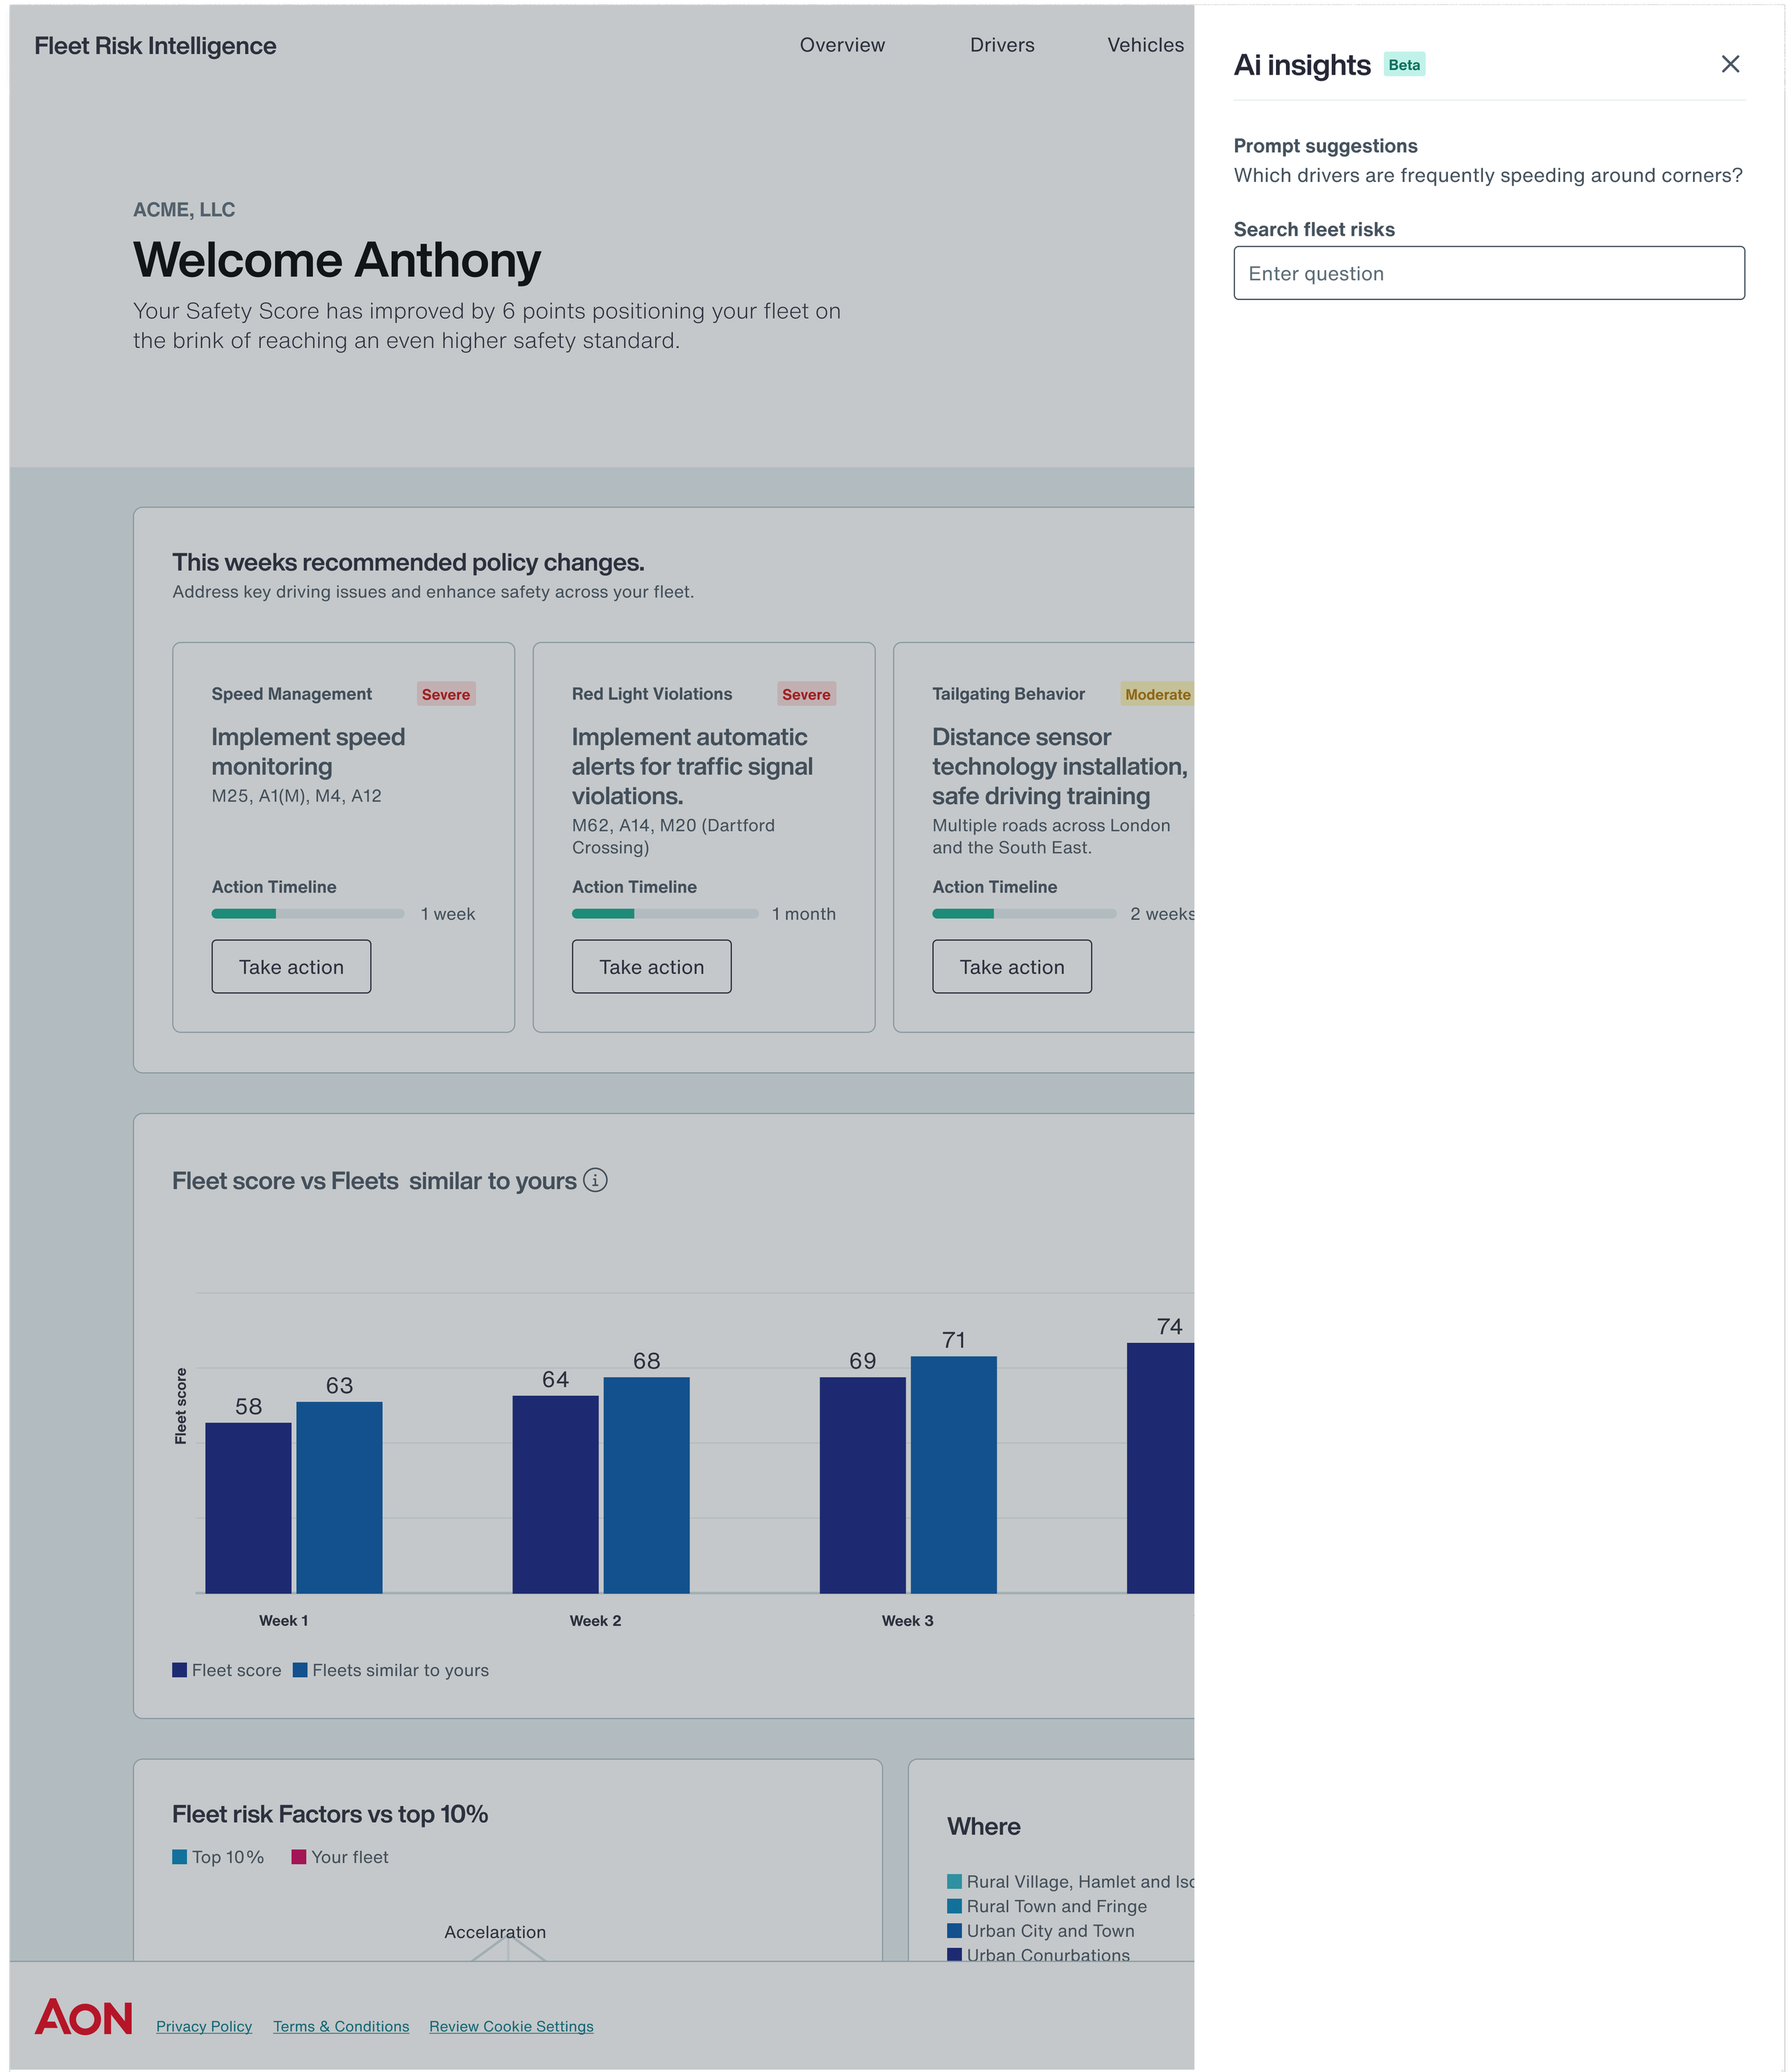
![]()
Incorporating ai search.
Key Point: Aon has its own NLM (Natural Language Model), which influenced our approach to data querying.
Result: Users now have greater autonomy to segment and filter data as needed. -
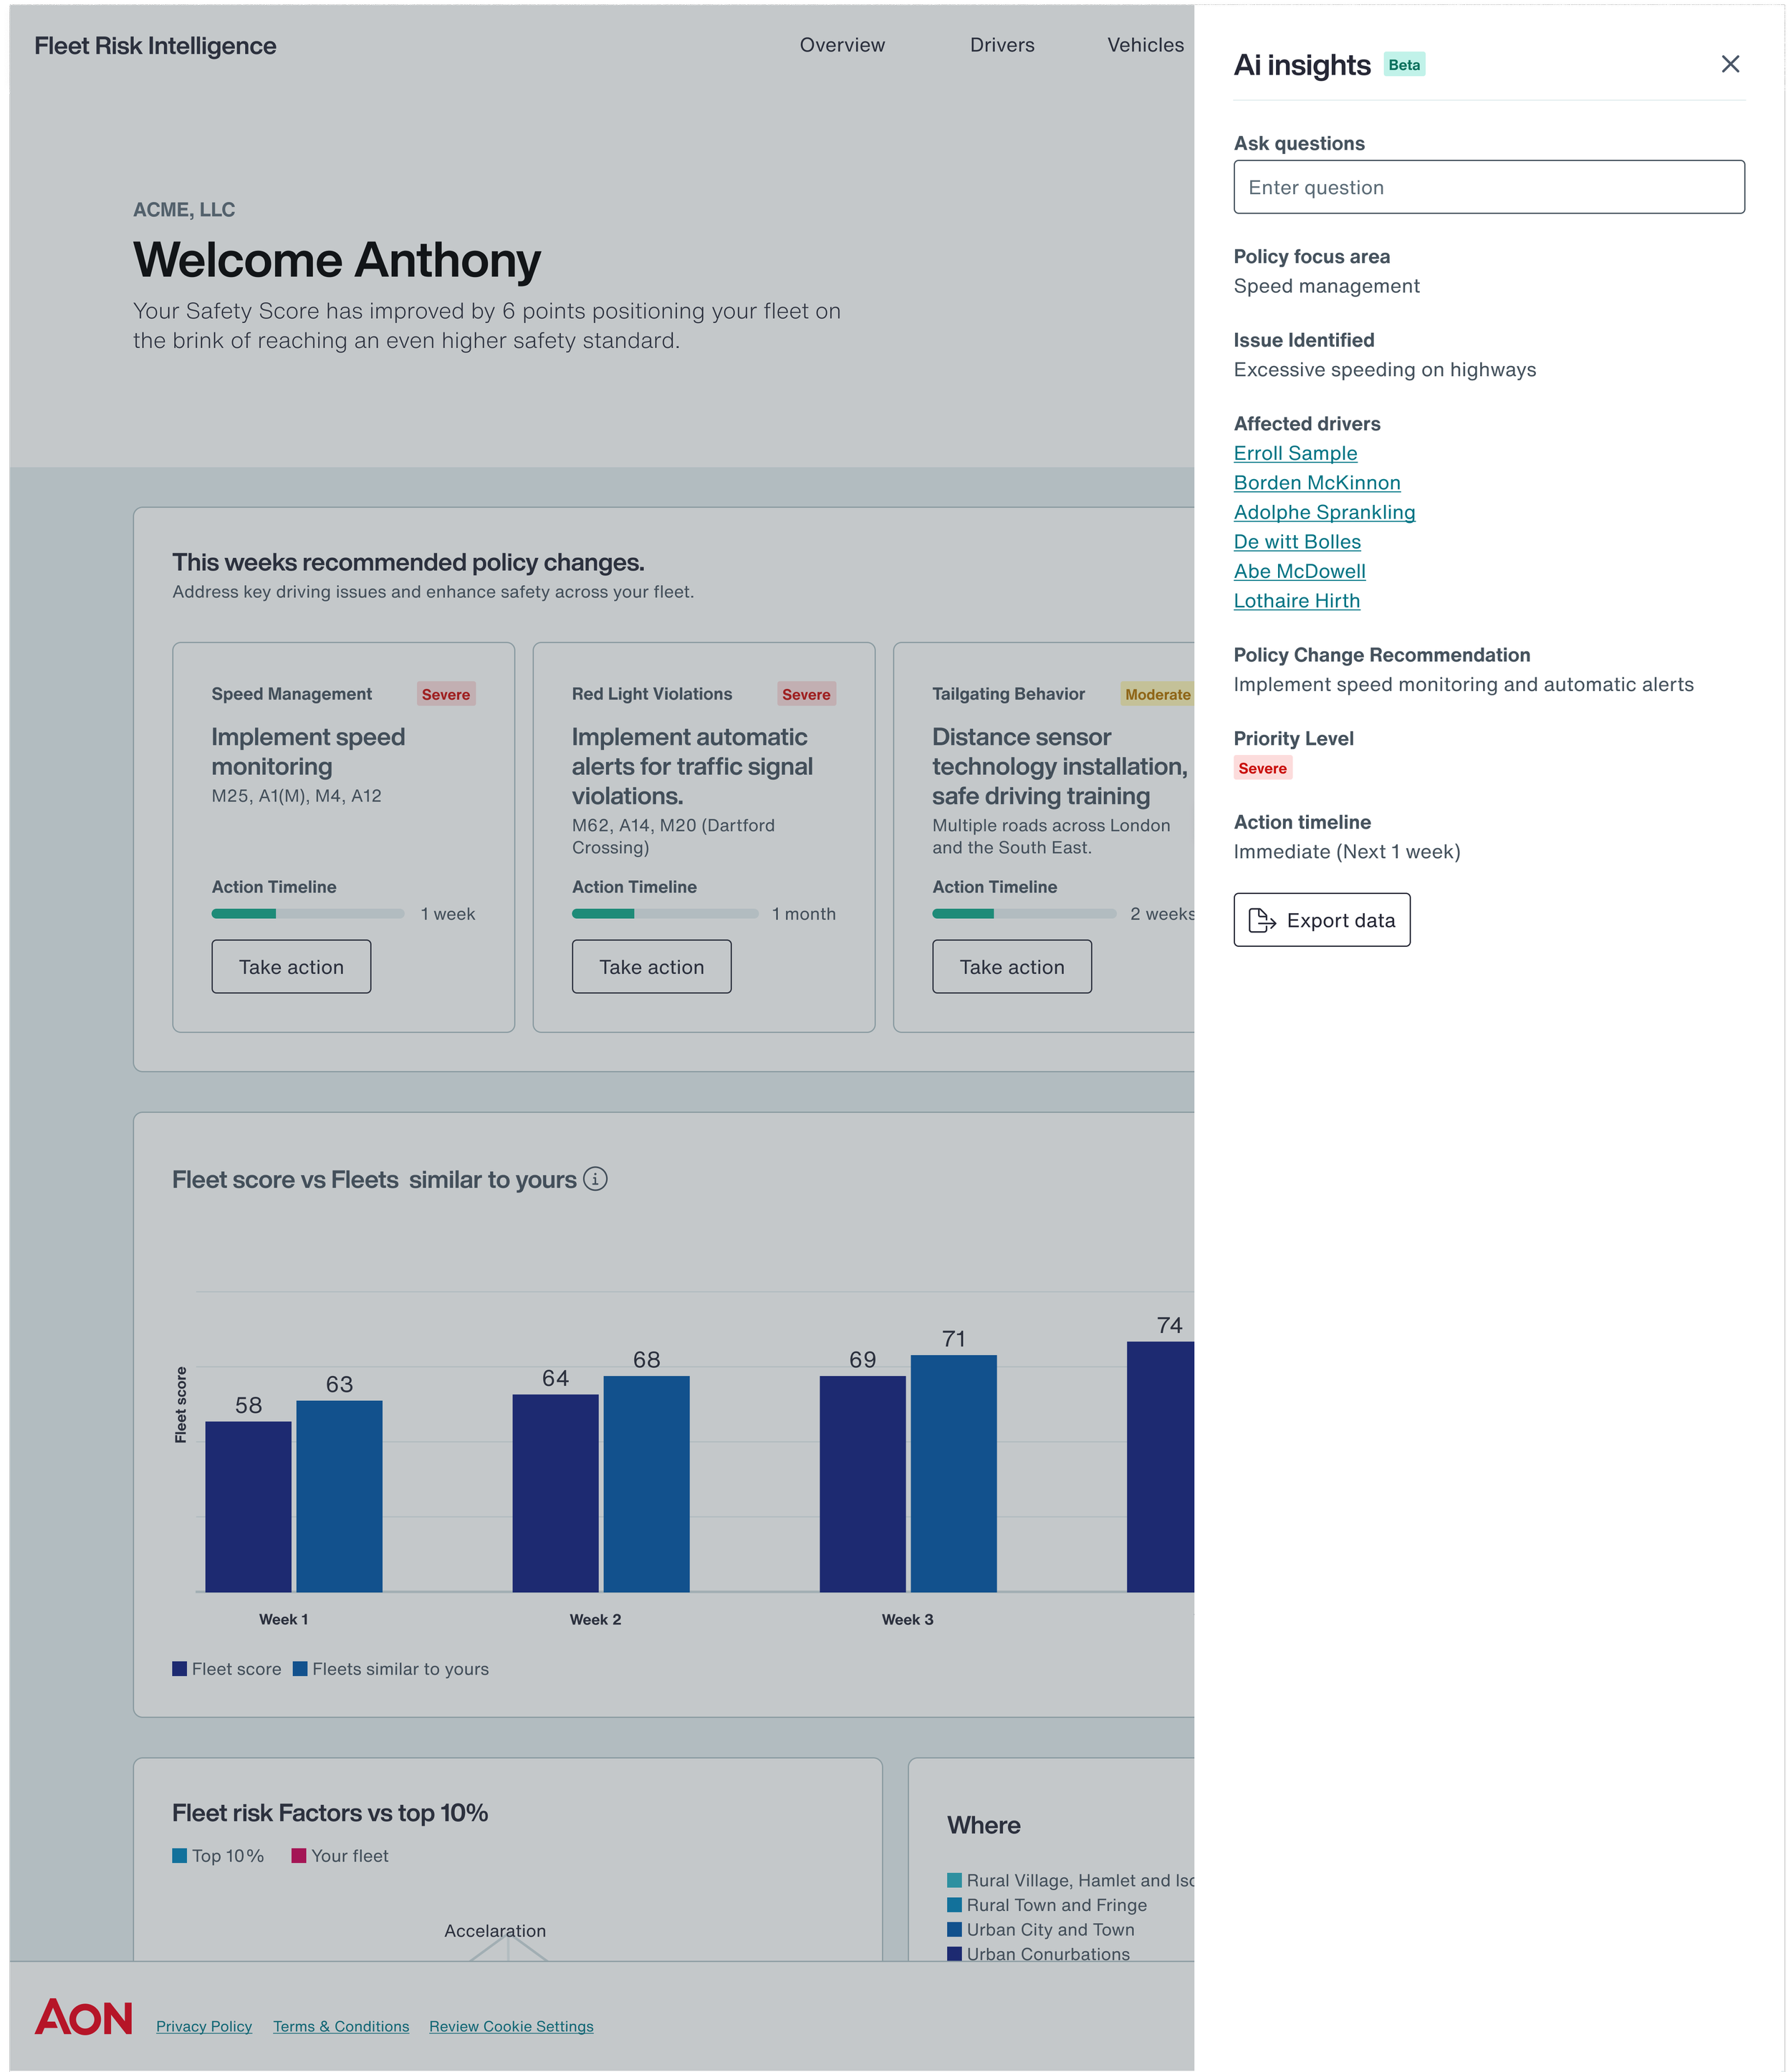
![]()
NLM search patterns
Research Focus: Analyzed widely-used Natural Language Models (NLMs) and reviewed UX best practices for NLM search patterns from UX literature.
Design Objective: Aimed to create an intuitive and efficient search experience based on this research.
Consistency: Leveraged Aon’s design library to ensure visual and functional consistency across the platform.
-
![]()
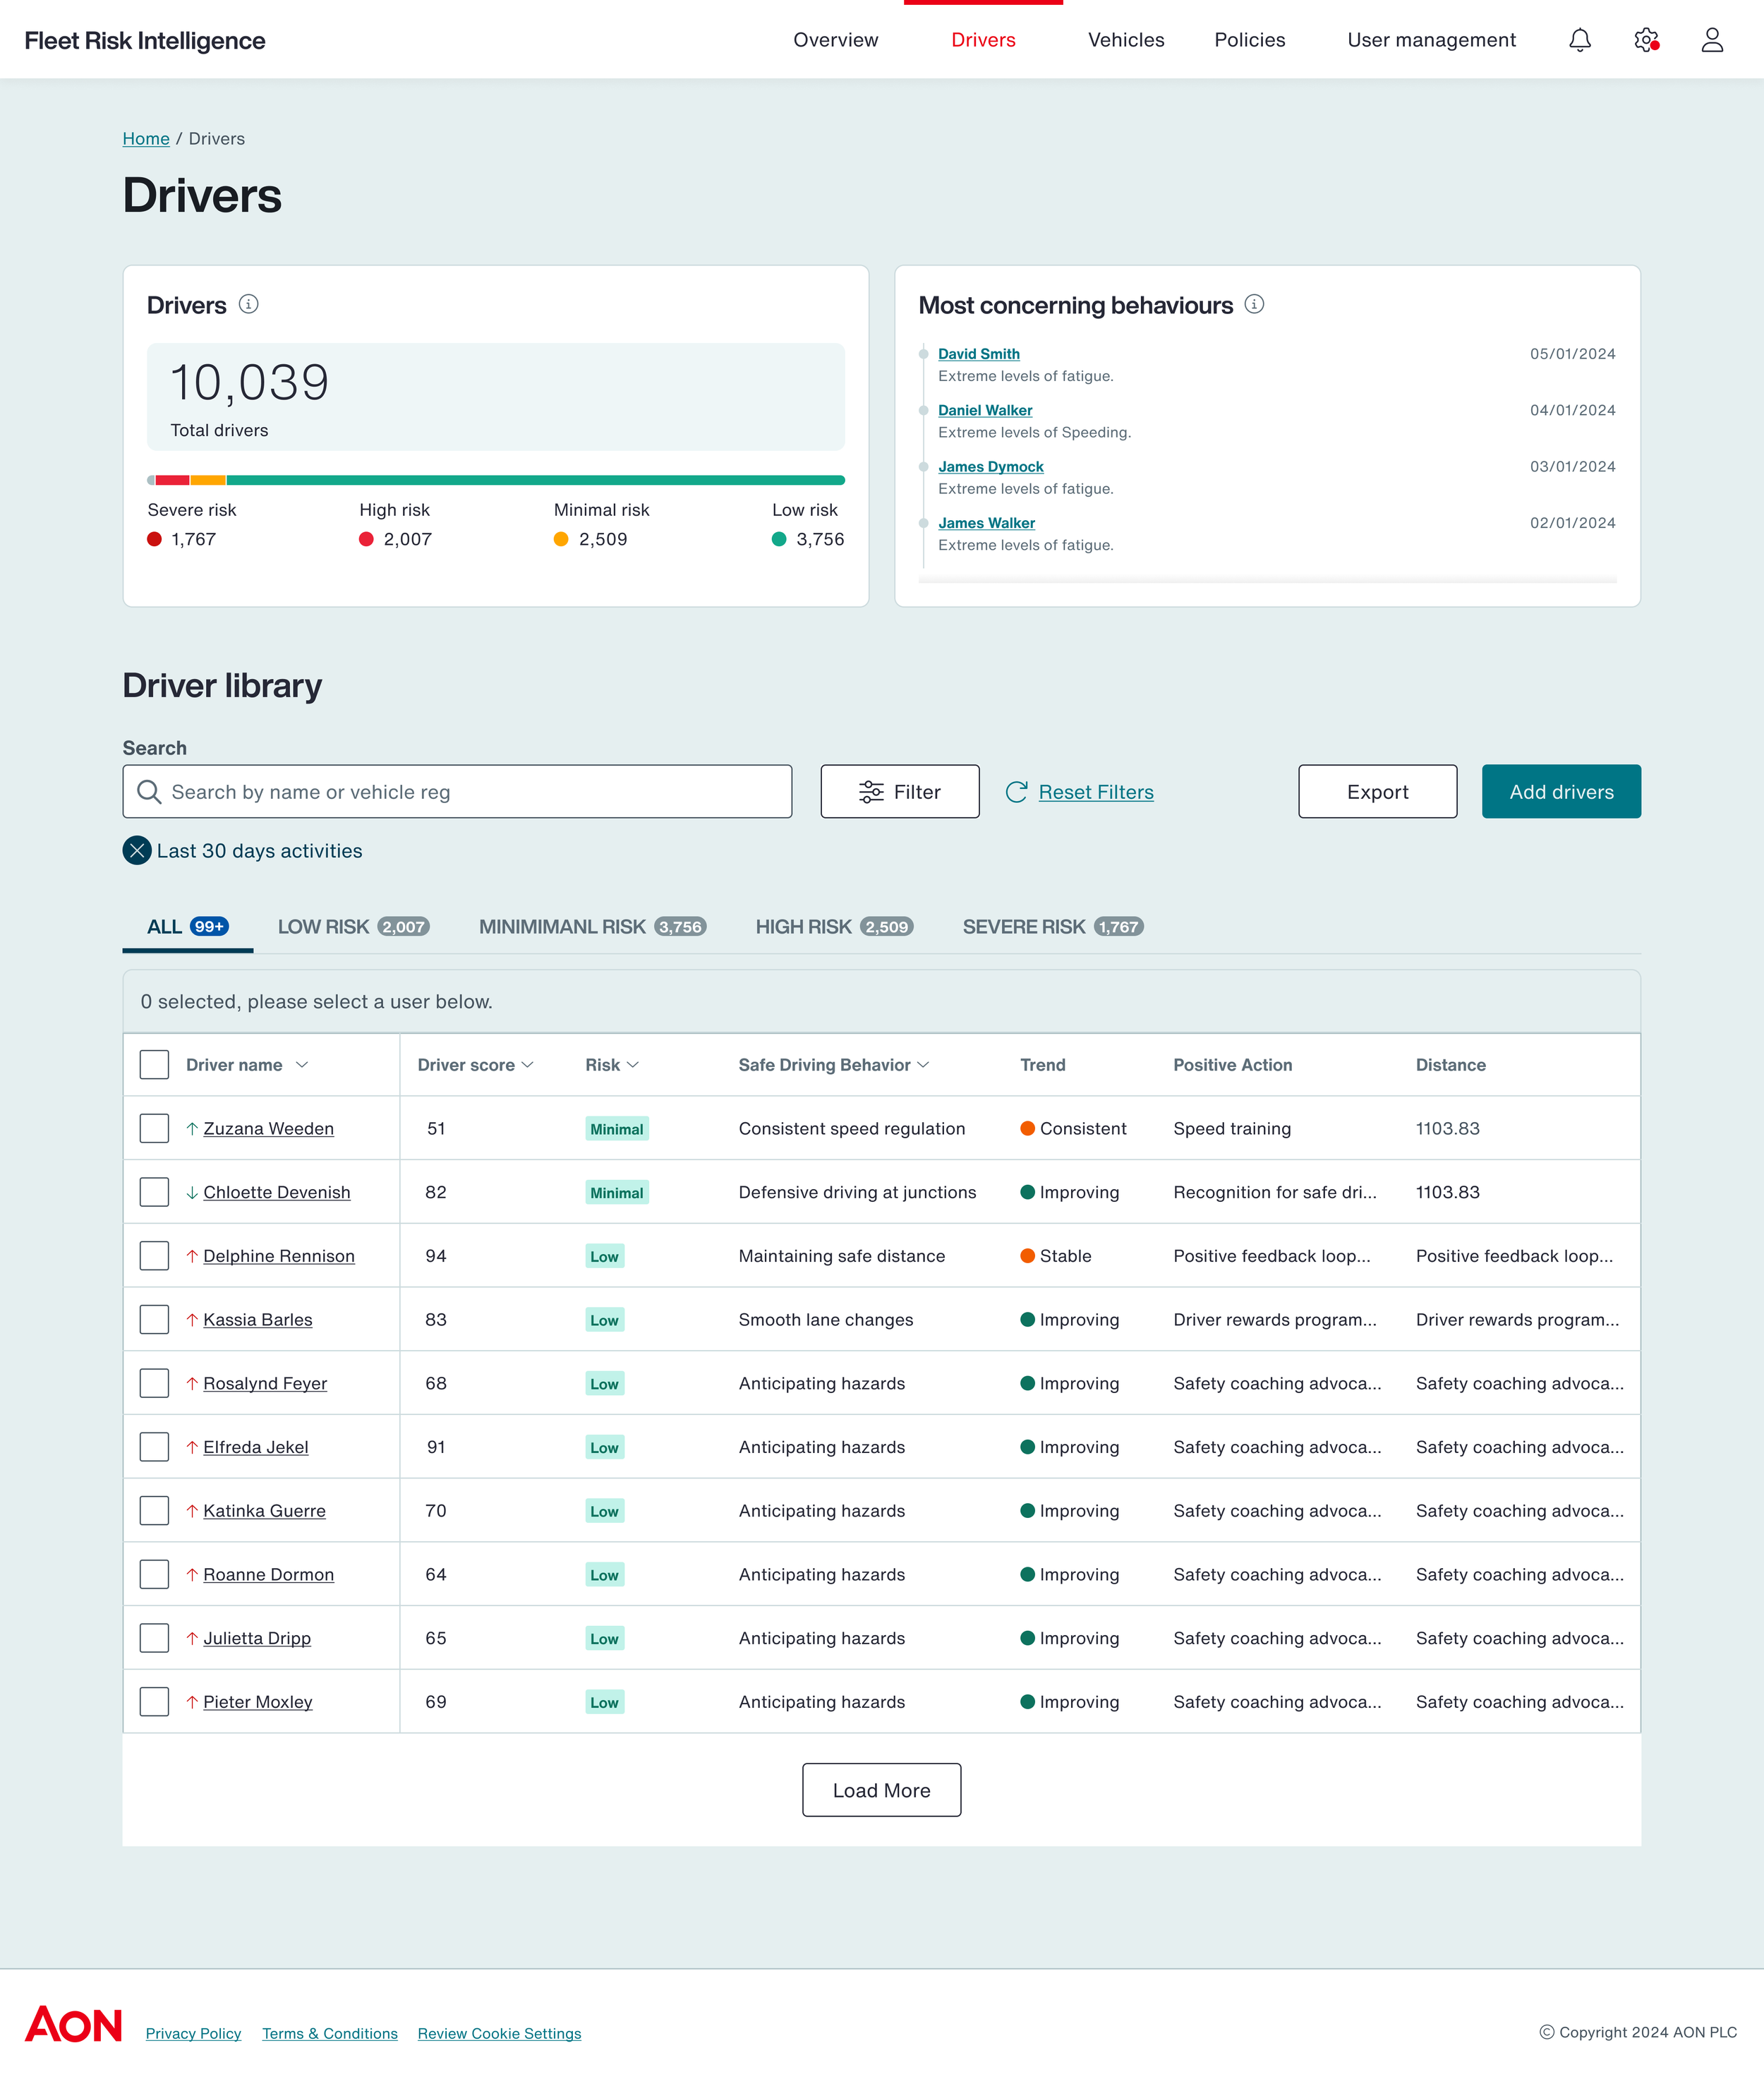
Drivers dashboard
Top priority: Focused on ease of use for users.
Seamless experience: Ensured new local components mirrored the previous iteration’s behavior.
User familiarity: This minimized the learning curve and kept users comfortable.
Key outcome: Successfully integrated updates without disrupting existing workflows.
-
![]()
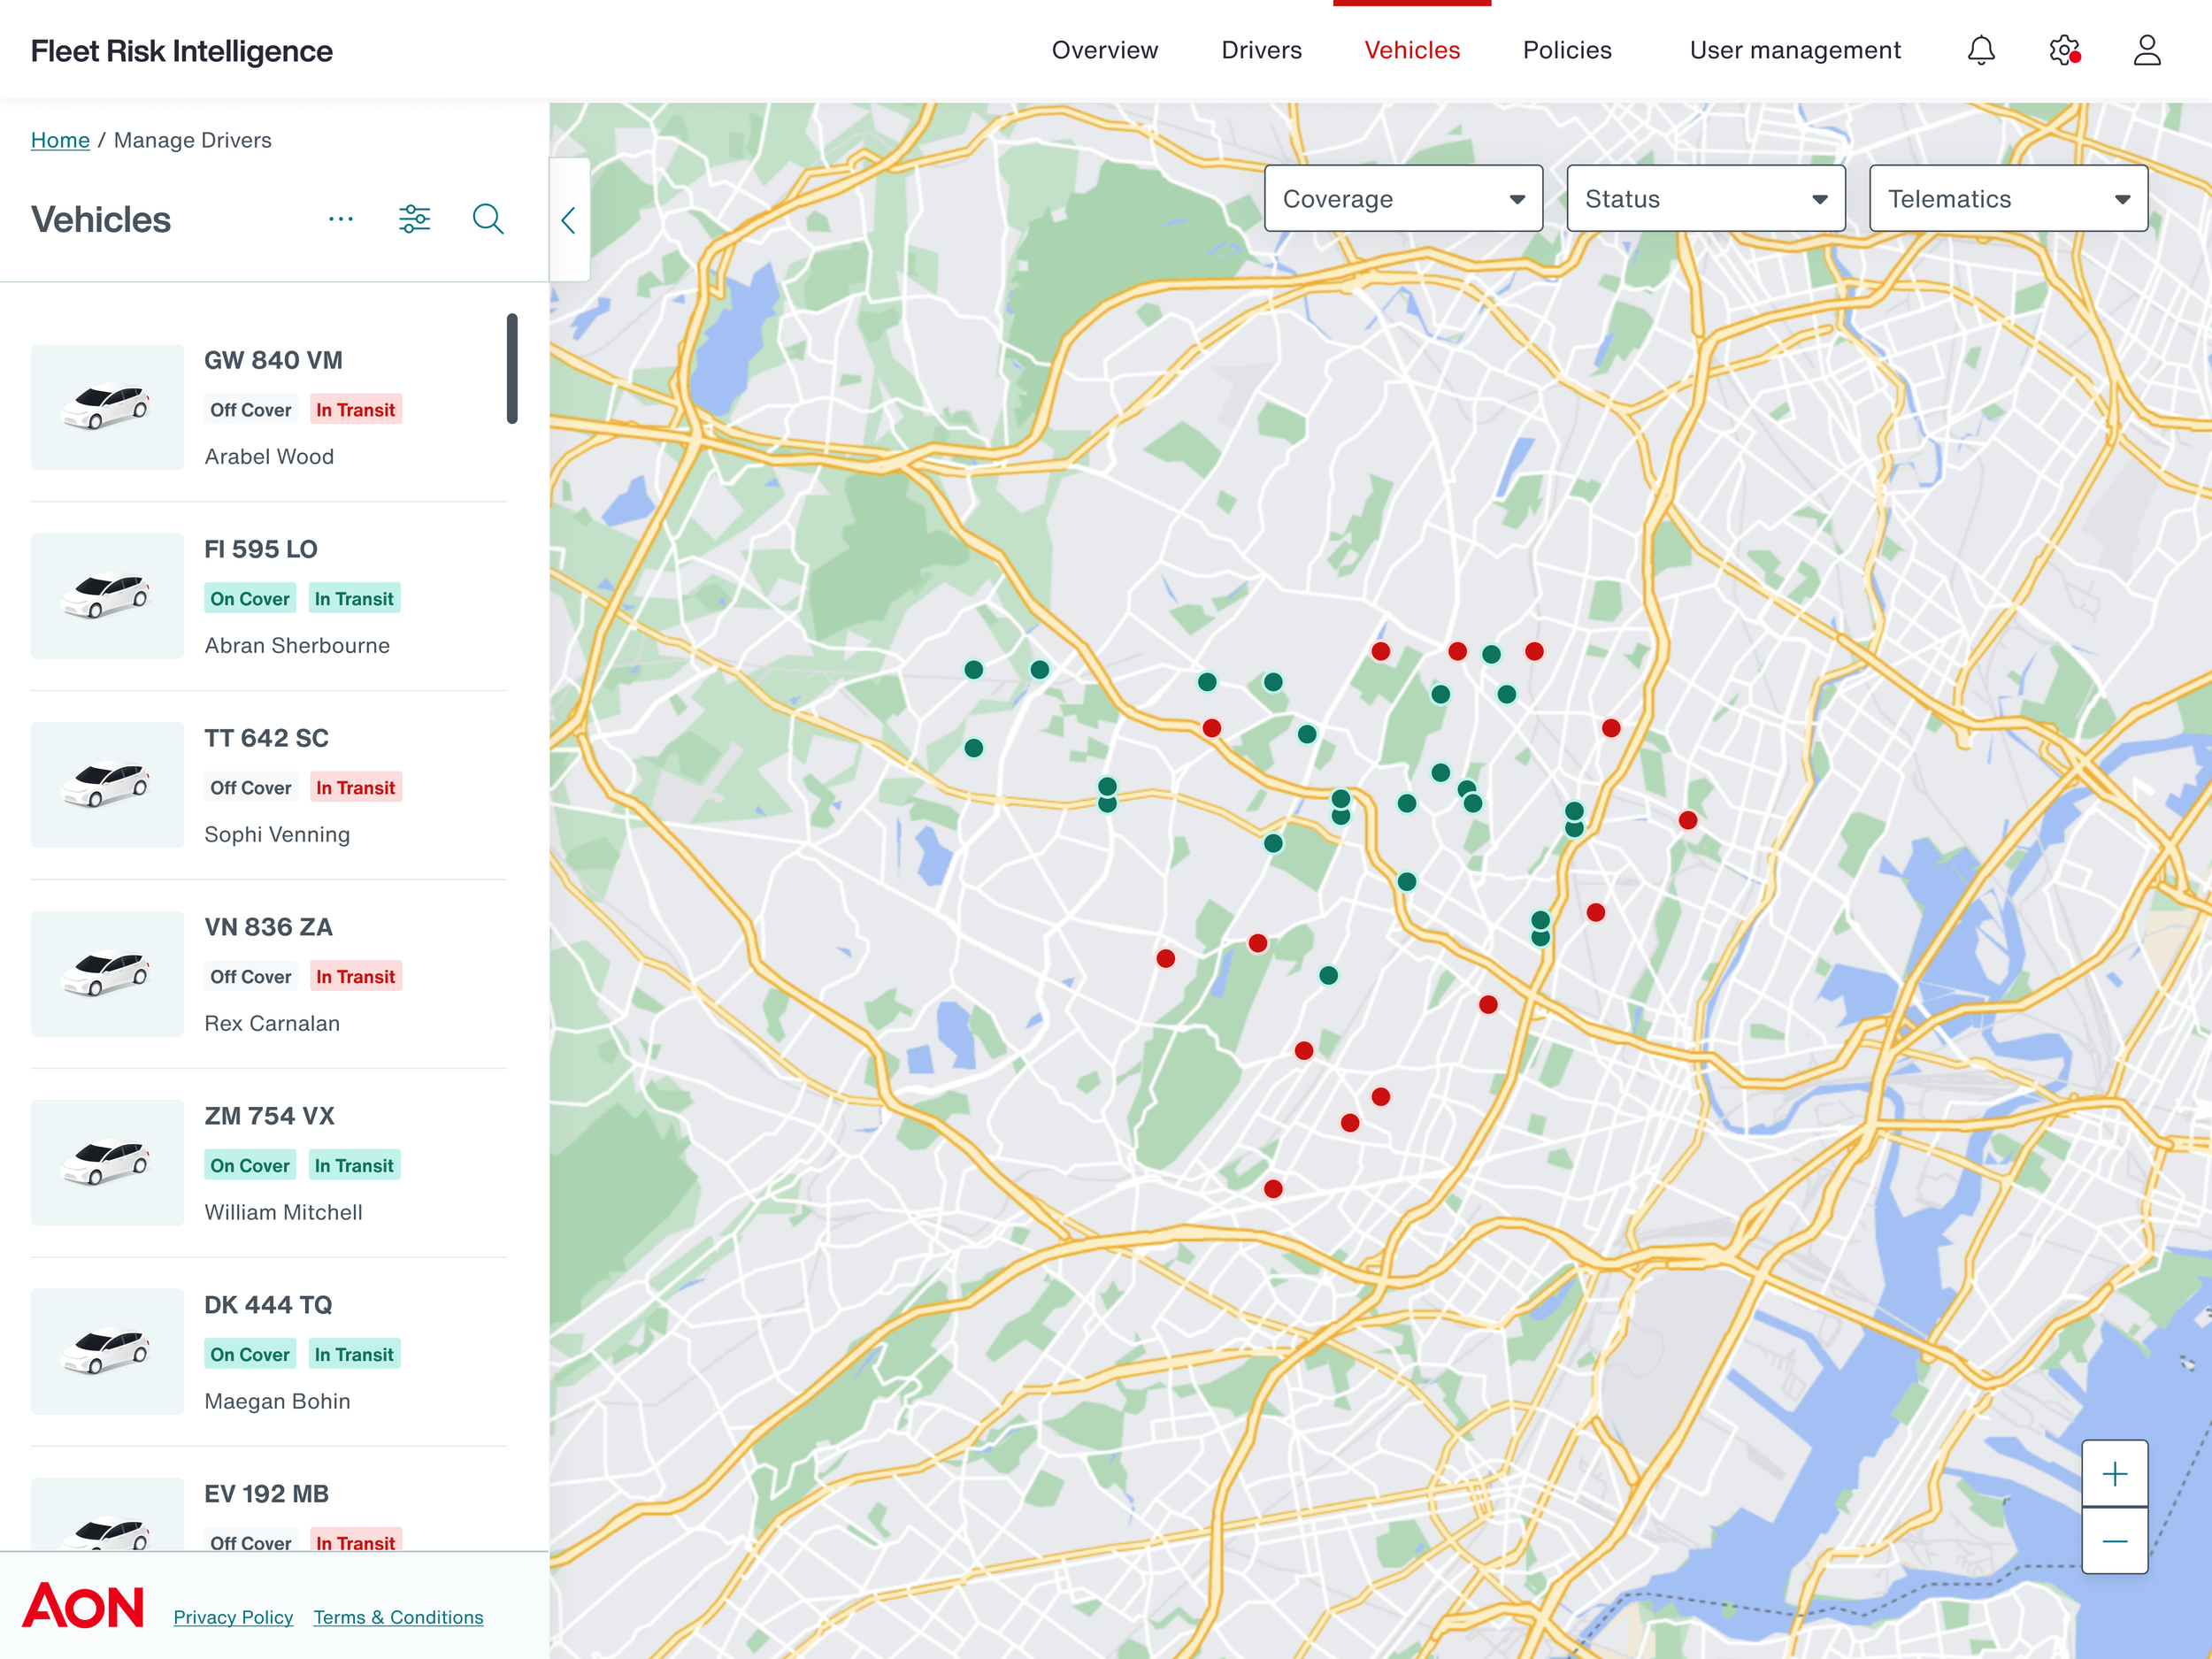
Adapting Mapbox to Aon’s Brand
Aligned Mapbox’s color palette with Aon’s brand identity while ensuring clarity and usability.
Focused on ensuring colors were visually aligned with Aon’s brand but still supported clear data visualization and user-friendly design.
Refined colors to create a harmonious blend of branding and usability.
-
![]()
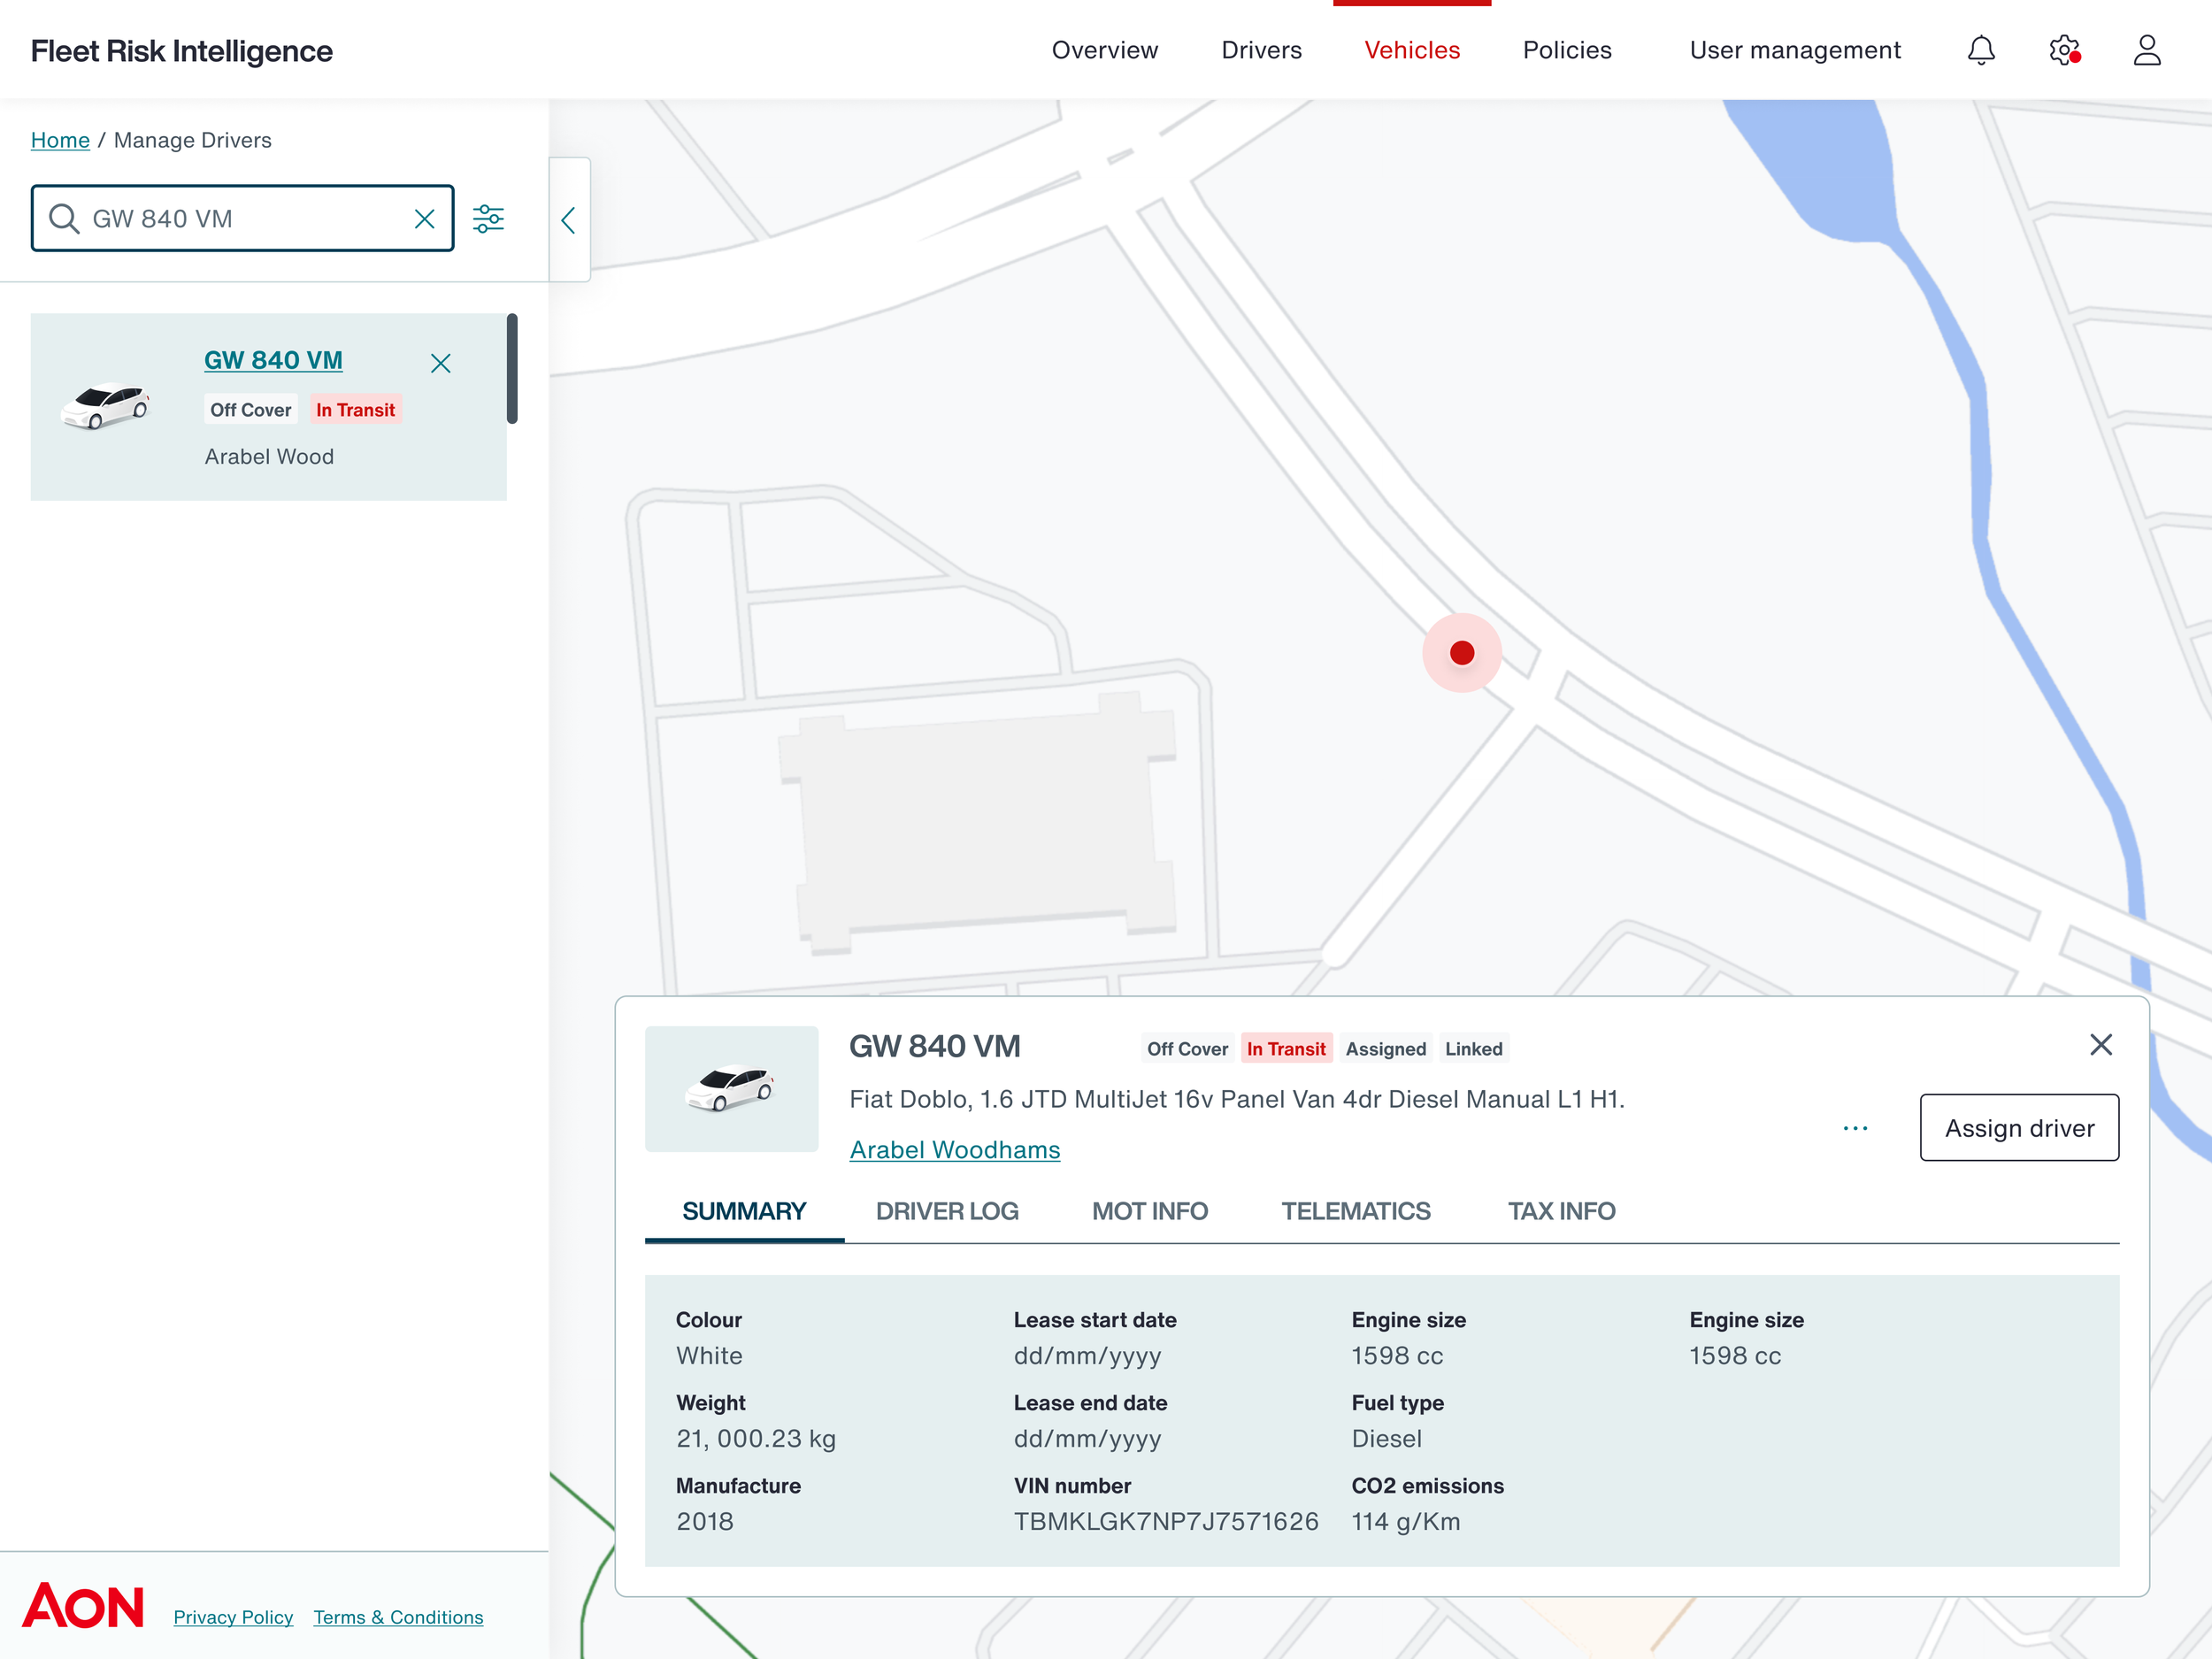
Approach and Process
Objective: Conducted a color audit to align Mapbox’s default palette with Aon’s brand guidelines.
Compared default vs. brand colors for consistency.
Iteratively adjusted hues, contrast, and saturation to ensure readability and visual distinction.
Achieved a brand-aligned map design.
Ensured usability wasn’t compromised, creating a clear and accessible map experience.
-
![]()
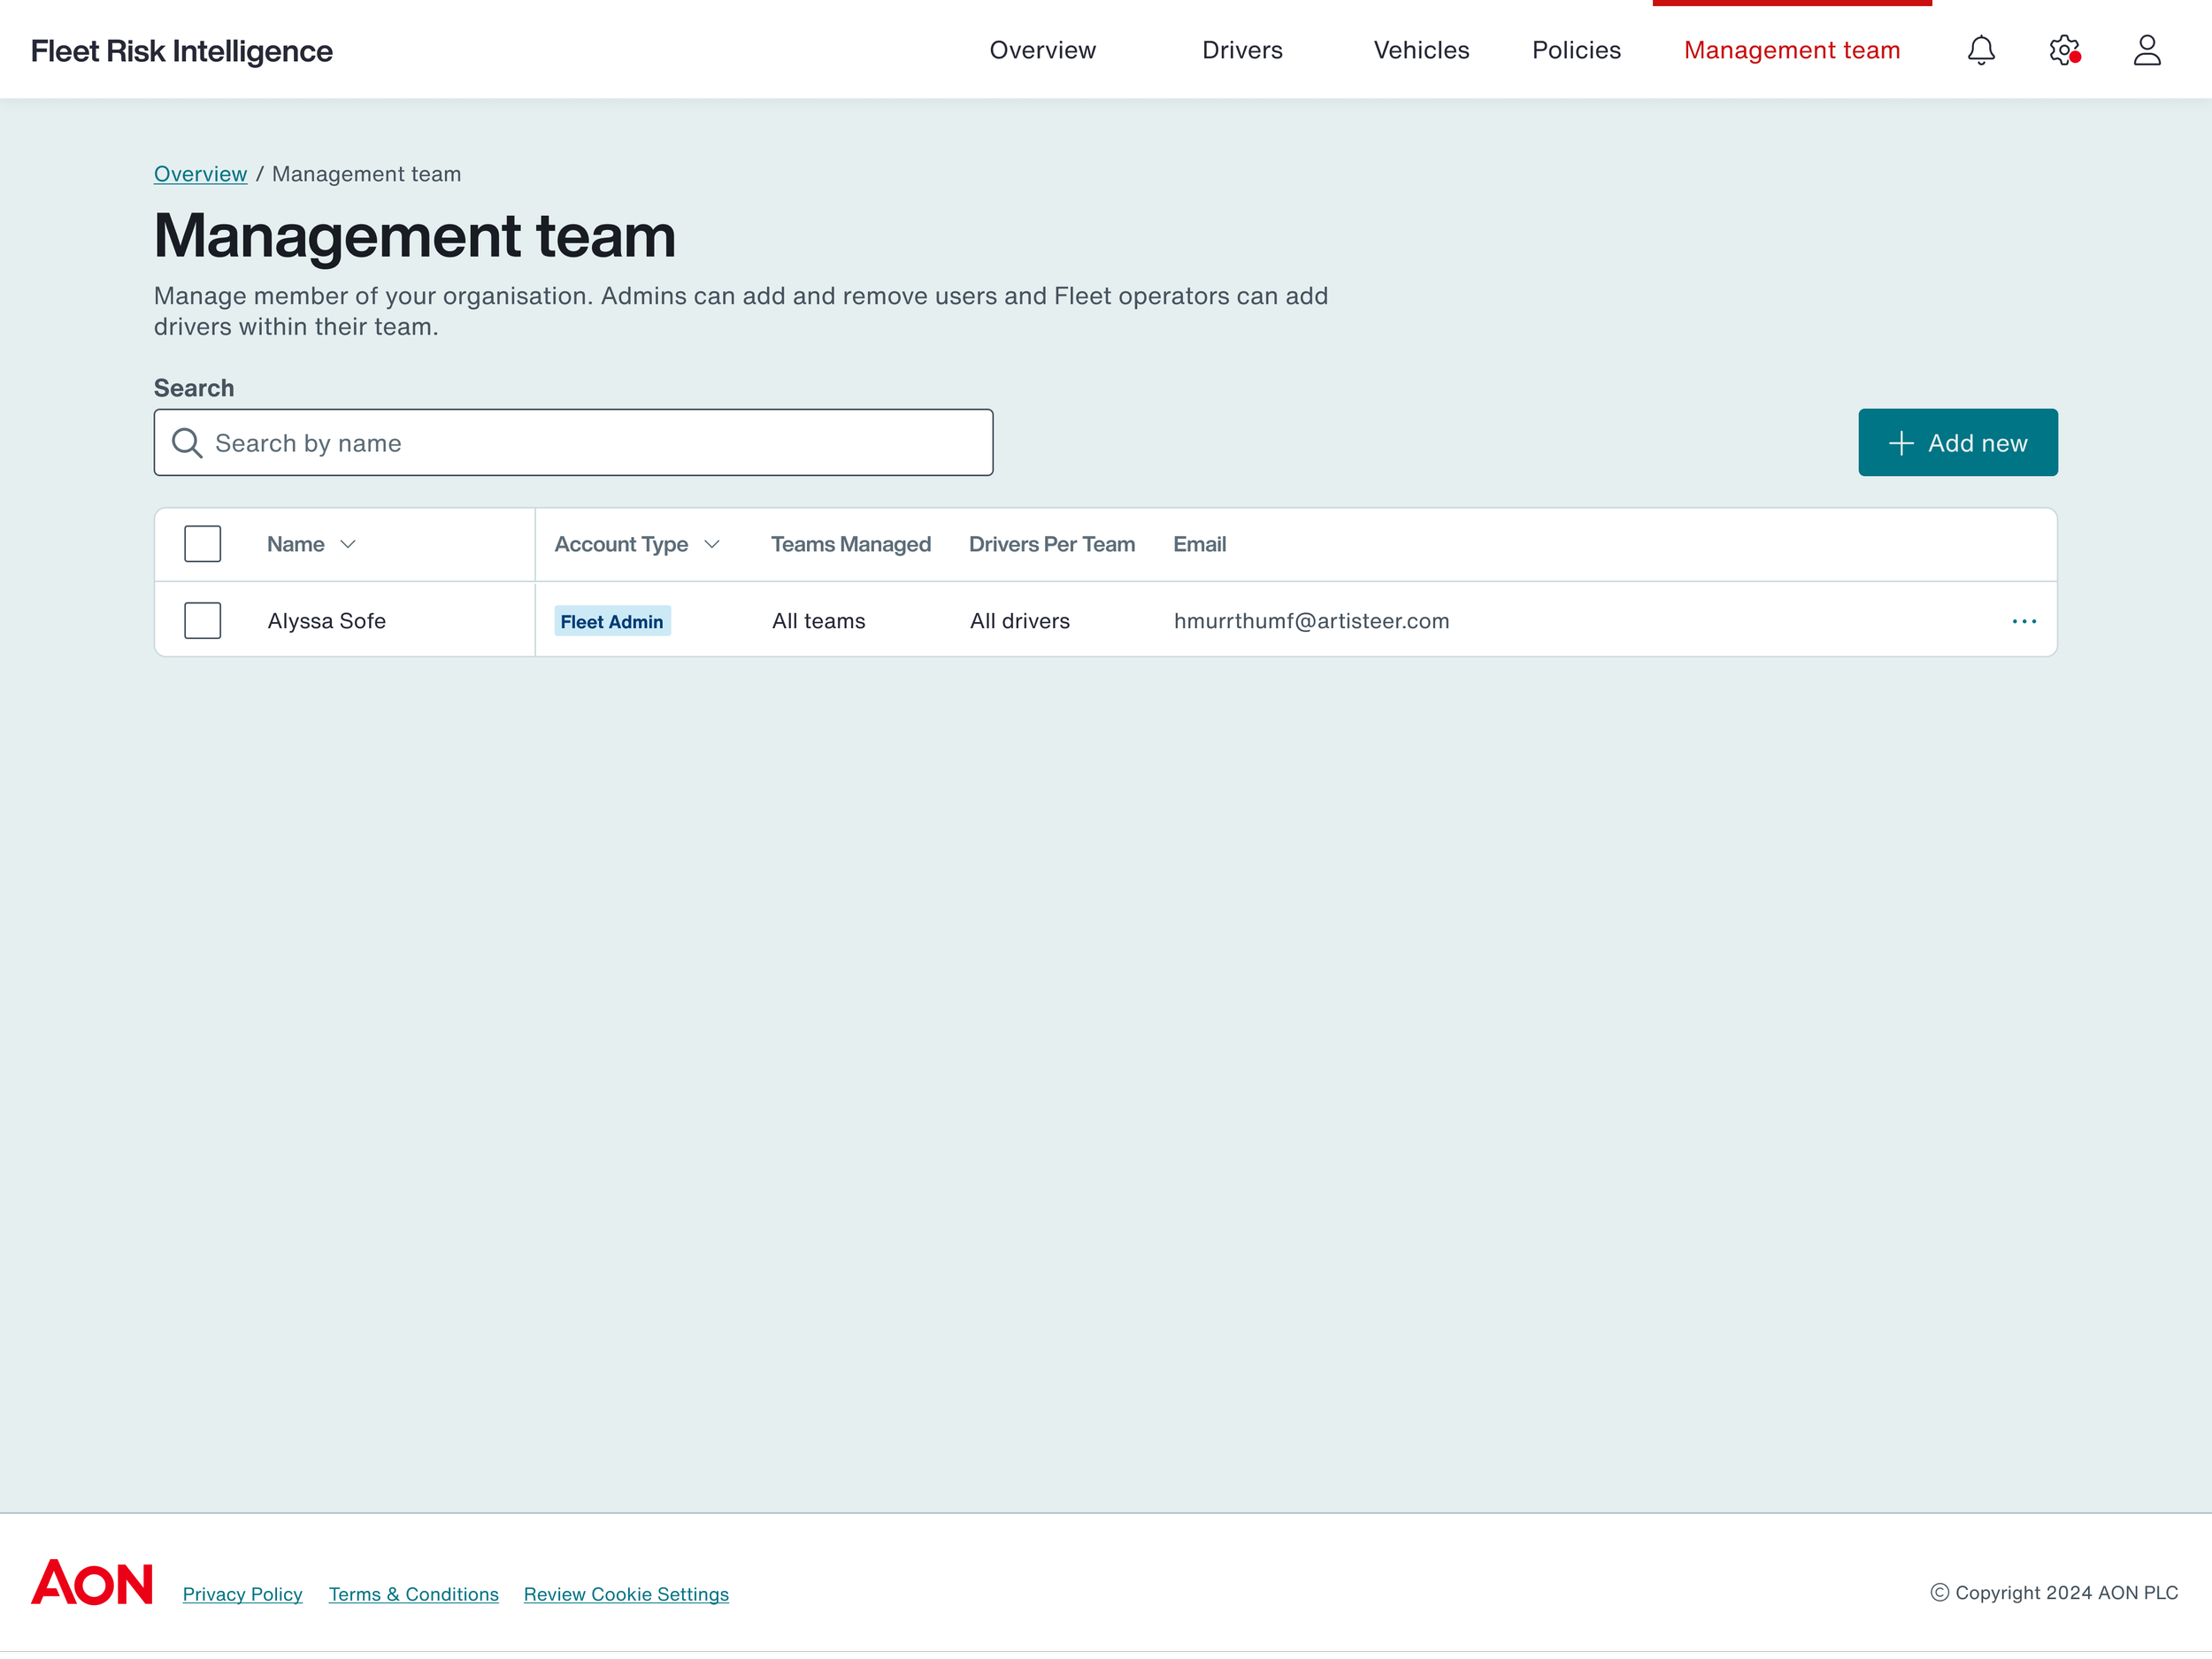
Design debt
Previous iterations led to a backlog of key features to be added.
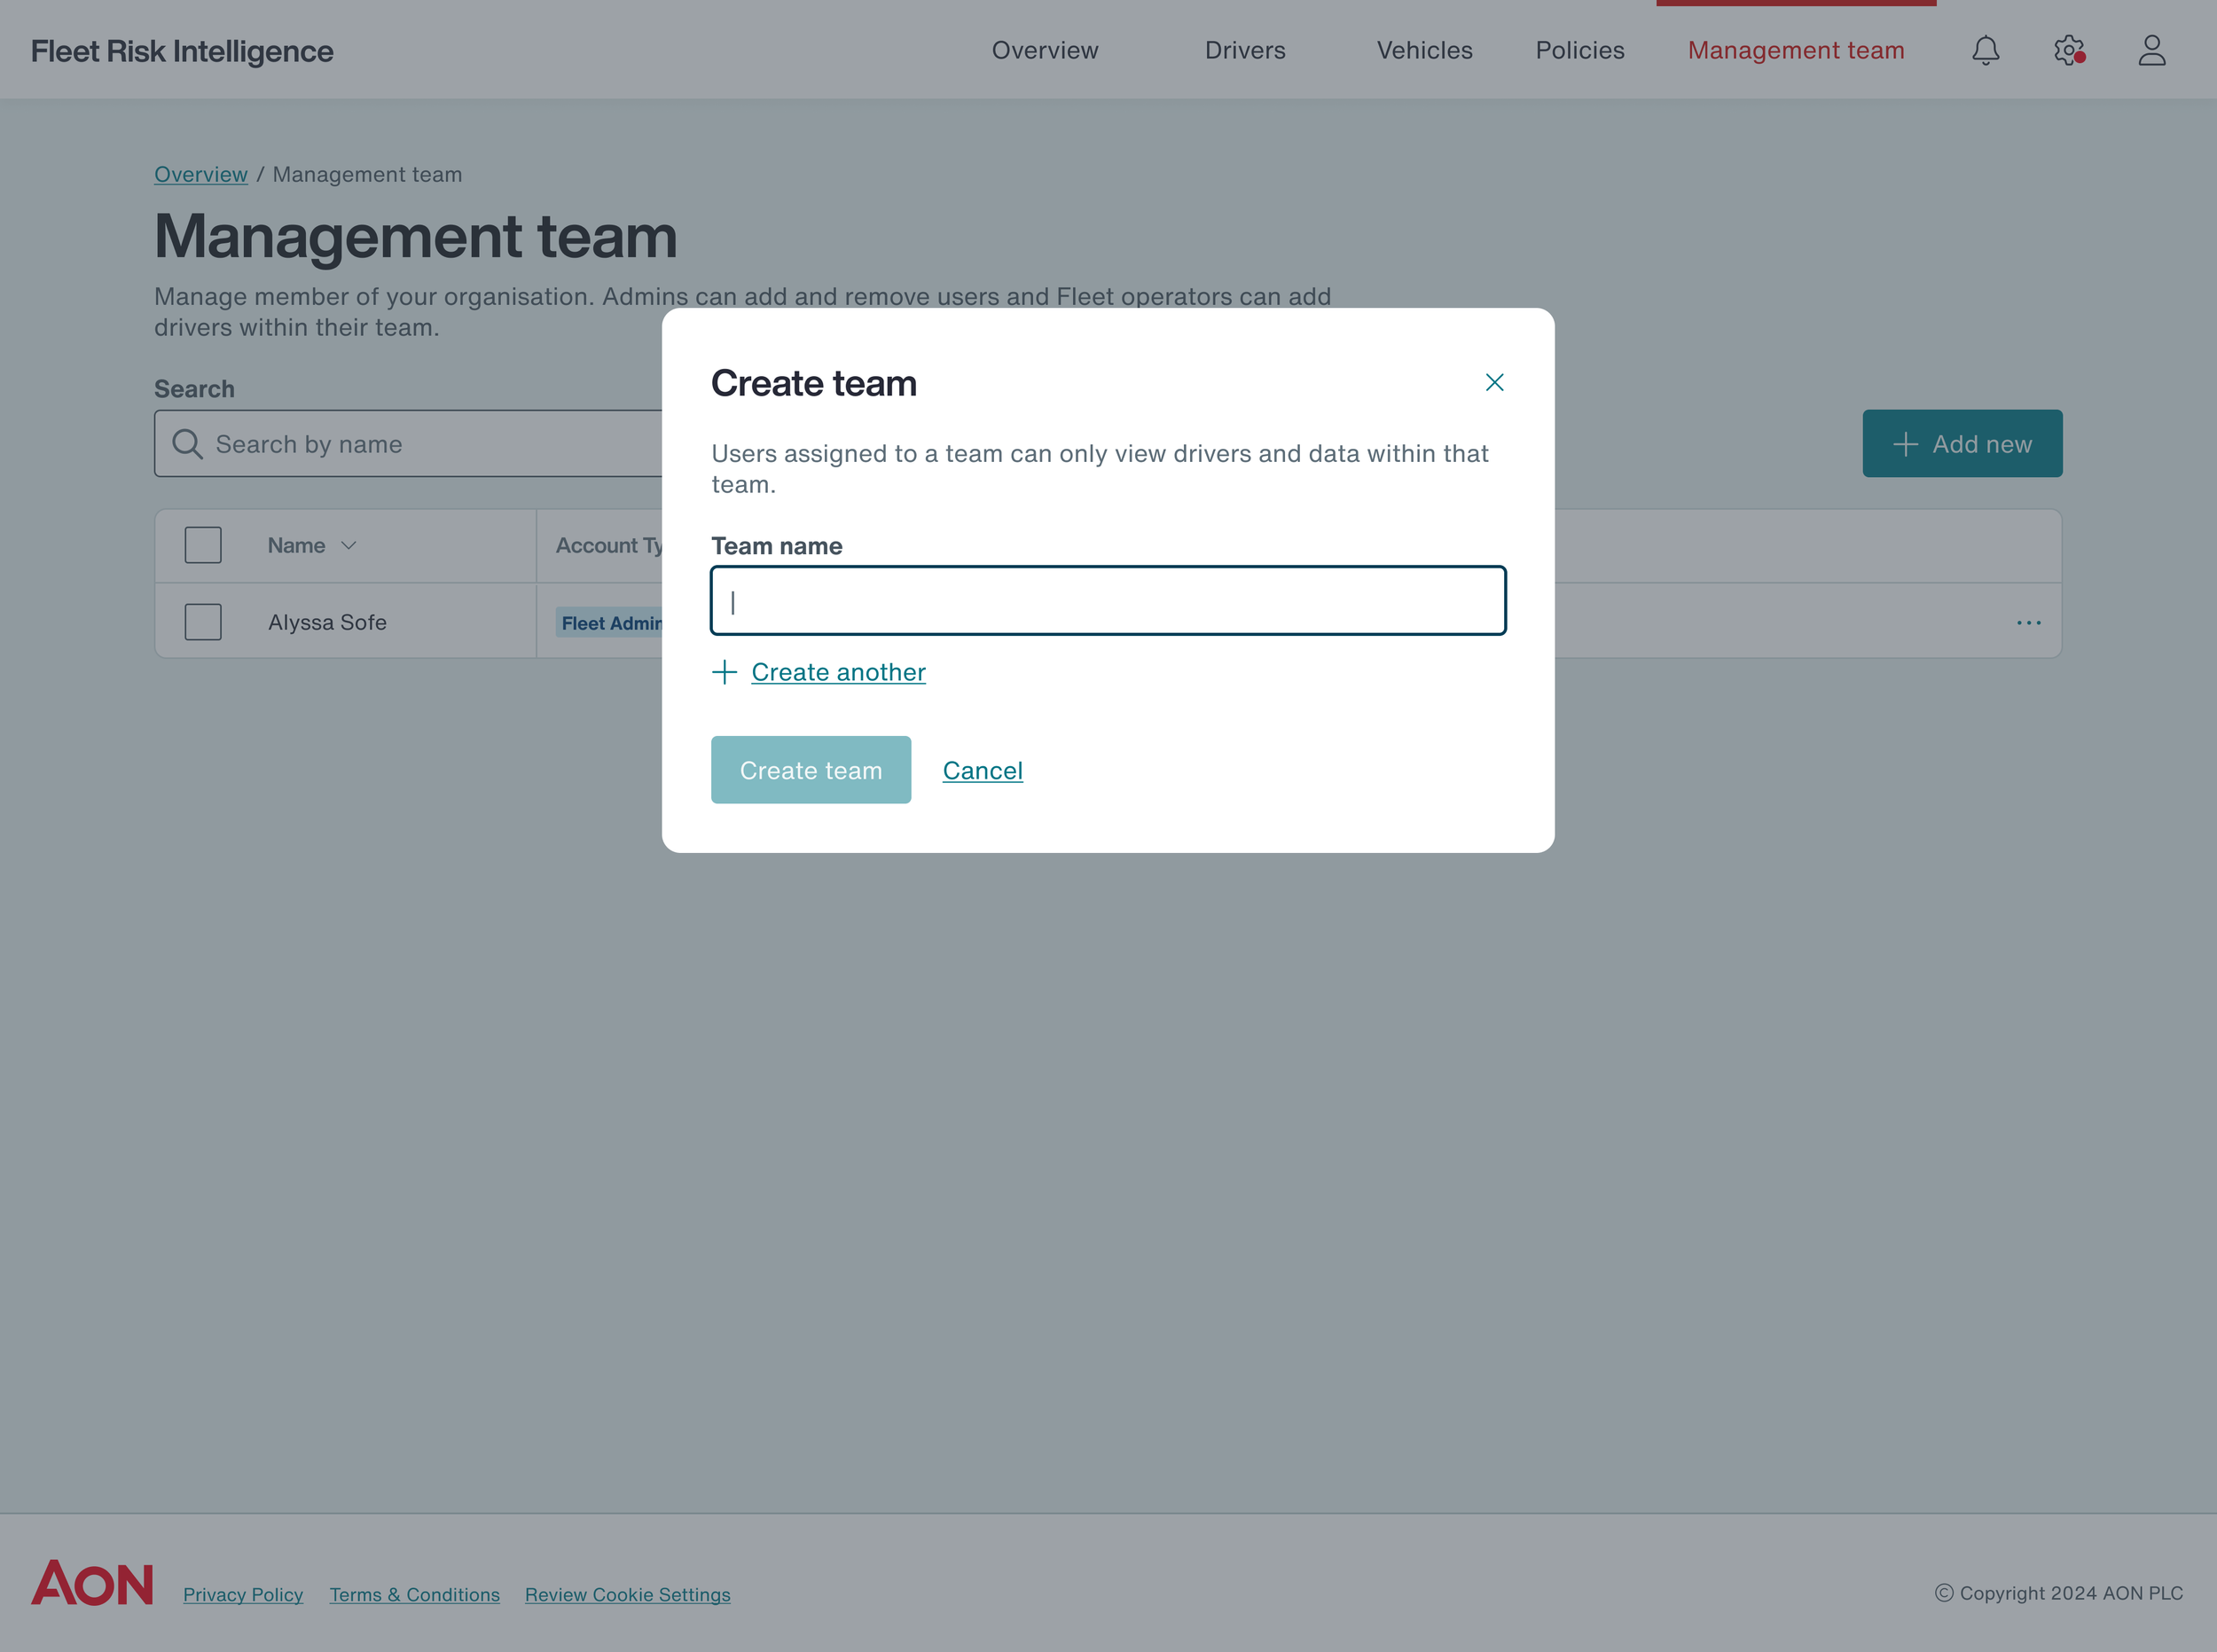
One of the priority features was User Management for Fleet Managers.
Need: Fleet managers required better control over user roles, access permissions, and team management for more efficient workflows.
Impact: This feature would improve collaboration, streamline administrative tasks, and offer better data security by controlling who accesses what.
-
![]()
Updating Research
Conducted a thorough gap analysis to compare the current state with the new value proposition post-acquisition.
Identified key adjustments needed to align the platform with updated business goals.
Used a structured process for wireframing, prototyping, and iterative testing.
Focused on ensuring designs met both user needs and business objectives.
Impact and outcomes
📊 User Success
✅ 40% faster risk analysis –risk assessment previously took 5 minutes and now takes 3 minutes.
✅ 25% increase in engagement with key insights.
🏆 Business Impact
✅ Higher platform adoption among fleet managers.
✅ Strengthened Aon’s position in B2B fleet risk intelligence.
🚀 Key Takeaways
✔ Data visualization is critical in complex platforms.
✔ User feedback loops drive engagement & usability.
✔ Cross-functional collaboration ensures scalable solutions
